

Table of Contents
- Introduction
- Quick Shopify Statistics
- Shopify Active Merchants Stastics (2012 to 2026)
- Shopify App Store Statistics
- Top Categories for Shopify Stores
- Shopify Global Market Outlook
- Competitive Landscape
- Shopify Technology Statistics – The Technologies Running Shopify Stores
- Shopify Shipping Carriers Statistics – Top Shipping Carriers Used by Shopify Stores
- Shopify Themes Statistics – The Most Popular Shopify Themes
- Wrapping Up
Shopify has played a central role in the e-commerce world. It enables businesses to build, manage, and scale their sales and online operations efficiently. As the global e-commerce trends are expected to reach $32.8 billion by the end of 2026, Shopify is constantly dominating the global e-commerce market.
This blog breaks down the most important Shopify statistics to help you understand what they mean for your business. In this report, we will cover detailed Shopify statistics that you need to know in 2026.
Quick Shopify Statistics
1) Shopify generated $11,556 million in revenue in 2025.
2) In Q4 2025, revenue reached $3,672 million, reflecting a 31% year-over-year increase.
3) The platform processed $5,555 million in gross merchandise volume (GMV) annually in 2025.
4) There are approximate 2,920,919 live stores running on the Shopify platform.
5) Shopify holds around 10.32% of the global e-commerce platform market.
6) In the United States, its market share stands at about 29%.
7) Shopify operates in more than 175 countries globally.
8) Shopify recorded $14.6 billion in sales over the Black Friday Cyber Monday (BFCM) weekend in 2025, up 27% from 2025 and 24% on a constant currency basis.
About Shopify
Founded in 2006 in Ottawa, Shopify is an e-commerce platform that helps businesses build, manage, and scale online stores from a single, integrated system. It provides tools for website creation, secure payments, inventory management, marketing, and order fulfilment, making it easier for merchants to operate efficiently without advanced technical knowledge.
Designed to support businesses of all sizes, Shopify also allows multichannel selling across websites, social media, and marketplaces, helping brands reach wider audiences and grow their online presence.
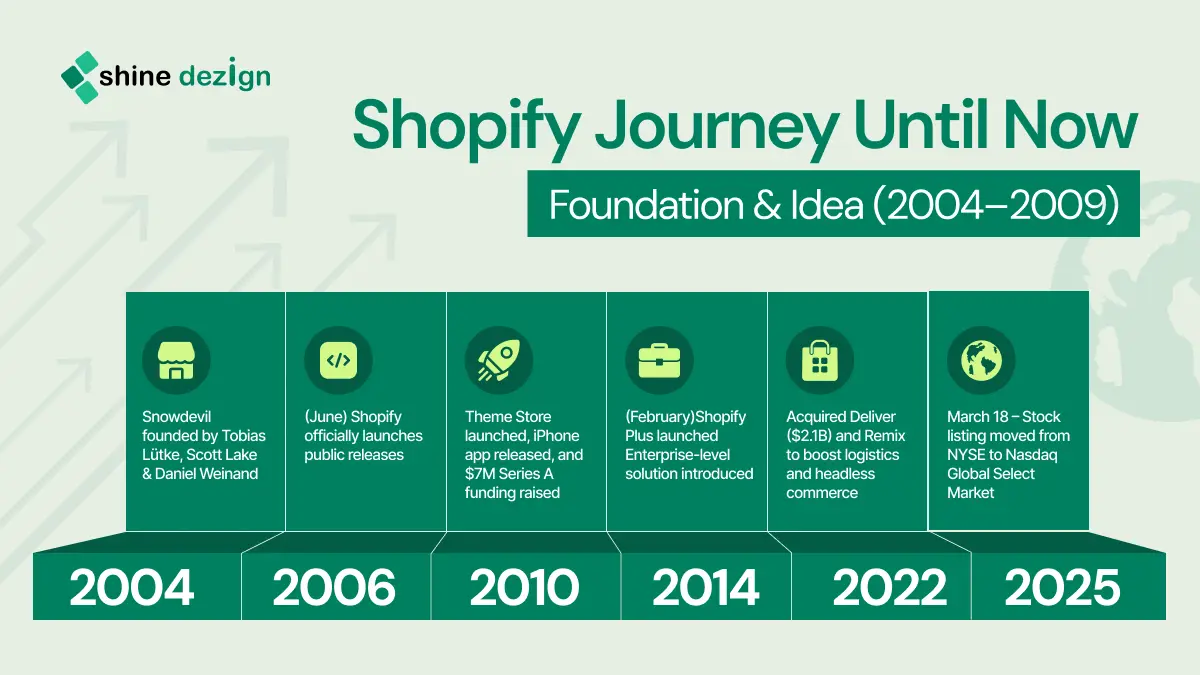
Shopify Journey Until Now
Shopify Active Merchants Statistics (2012 to 2026)
| Year | Number of Merchants |
|---|---|
| 2026 (Q1) | 6.5M+ (estimated) |
| 2025 | 4M- 6.5M (Approx) |
| 2024 | 2.4M – 4M+ ((Shopify stopped revealing exact figures) |
| 2023 | 2.06 M – 2.4 M |
| 2022 | Approx. 2.06 M |
| 2021 | 1,750,000+ |
| 2020 | 1,749,000 |
| 2019 | 1,069,000 |
| 2018 | 820,000 |
| 2017 | 609,000 |
| 2016 | 375,000 |
| 2015 | 243,000 |
| 2014 | 145,000 |
| 2013 | 84,000 |
| 2012 | 41,000 |
Top countries for Shopify stores
Shopify powers an estimated million 2,920,919 active online stores worldwide, with a significant concentration in the United States around 1,084,921 stores are currently active. Therefore, The United States alone accounts for more than 1 in 3 stores worldwide.
| Country | Stores |
|---|---|
| United States | 1,084,921 |
| United Kingdom | 218,747 |
| Canada | 142,899 |
| Australia | 132,171 |
| India | 125,926 |
| Fance | 100,880 |
| Germany | 98,955 |
| Netherlands | 65,819 |
| Italy | 56,093 |
Shopify App Store Statistics
Shopify Inc. has built one of the most extensive partner ecosystems in the e-commerce industry. Currently, over 12,000+ developers and vendors have contributed to the platform, collectively publishing more than 16000 apps in the Shopify App Store. This rich ecosystem plays a crucial role in extending store functionality from marketing and sales to customer engagement and fulfillment.
Across millions of stores, certain apps stand out due to their widespread adoption:
1) 19.3% of stores use Judge.me Product Reviews App
2) 14.1% rely on Klaviyo: Email Marketing & SMS
3) 13.1% have adopted Shopify Inbox
Top Shopify Apps by Installs
| App | Category | Number of Stores Using |
|---|---|---|
| Judge.me Product Reviews App | Review | 549,104 |
| Klaviyo: Email Marketing & SMS | Email Marketing | 397,668 |
| Shopify Inbox | Marketing & Messaging | 367,670 |
| Klarna On-Site Messaging | On-Site Messaging | 252,952 |
| Instafeed – Instagram Feed | Social Media | 235,516 |
| PageFly Landing Page Builder | Landing Page Builder | 184,787 |
| Shopify Forms | Lead Generation | 183,521 |
| Mailchimp Email SMS Marketing | Email Marketing | 148,484 |
| Printful: Print on Demand | Print on Demand | 141,344 |
Top Categories for Shopify Stores
With millions active stores on Shopify, the platform has become a window into what the world is buying and, more importantly, where the competition is fiercest. Whether you’re launching a new store or looking to niche down, knowing which categories are saturated and which are underserved can make or break your strategy.
Apparel dominates the platform by a wide margin. Still, the real story is that mid-tier categories like Health, Sports, and Arts & Entertainment are drawing hundreds of thousands of stores, signaling strong consumer demand well beyond Fashion. Here’s the full breakdown:
| Category | Stores |
|---|---|
| Apparel | 782,4068 |
| Home & Garden | 334,138 |
| Beauty & Fitness | 311,905 |
| Food & Drink | 199,134 |
| Health | 129,411 |
| People & Society | 112,772 |
| Sports | 106,224 |
| Arts & Entertainment | 101,481 |
| Toys & Hobbies | 76,141 |
| Autos & Vehicles | 66,857 |
| Pets & Animals | 66,607 |
| Business & Industrial | 64,084 |
| Gifts & Special Events | 53,598 |
| Consumer Electronics | 52,541 |
| Computers | 47,705 |
| Games | 29,062 |
| Books & Literature | 25,157 |
| Travel | 19,437 |
| Jobs & Education | 18,703 |
Shopify Global Market Outlook
The global Shopify market was valued at $12.8 billion in 2025 and is projected to reach $38.6 billion by 2034, expanding at a CAGR of 13.1% from 2026 to 2034.
Regional Market Share
The global Shopify market shows clear regional dominance, with North America leading in revenue share while Asia-Pacific is the fastest-growing region. This distribution reflects differences in digital infrastructure maturity, e-commerce adoption, and government-backed digital initiatives across regions.
North America led with 41.3% revenue share (~$5.3 billion), with internet and smartphone penetration exceeding 92%. The region is expected to grow at a CAGR of 11.4% through 2034. Let’s check out other key regions and countries.
| Region | Revenue Share (2025) | Market Value (Approx.) | Key Countries | Growth Rate (CAGR) | Key Growth Drivers |
|---|---|---|---|---|---|
| North America | 41.3% | ~$5.3 Billion | United States, Canada | 11.4% (till 2034) | Mature e-commerce ecosystem, high internet penetration (92%+), strong DTC brand growth, Shopify Payments & Capital expansion |
| Asia Pacific | 28.7% | — | China, India, Indonesia, Australia, Japan | 16.8% (Fastest) | Rapid e-commerce expansion, Digital India & UPI, mobile-first commerce, rising disposable income |
| Europe | 18.9% | — | UK, Germany, France, Benelux | — | Multi-currency demand, GDPR & DSA compliance needs, cross-border e-commerce |
| Latin America | 6.8% | — | Brazil, Mexico, Colombia | 15.2% | Growing middle class, improving digital payments, and rising smartphone usage |
| Middle East & Africa | 4.3% | — | GCC Countries, South Africa | — | Government digital initiatives, a young mobile-first population, and growing online retail |
Market Share by Business Size
Small and Medium Enterprises (SMEs) accounted for 67.2% of total market revenue, with over 3.2 million SME merchants globally. The SME segment is projected to grow at a CAGR of 12.8% through 2034. Large Enterprises held 32.8% of revenue share and are the fastest-growing segment, with a 13.8% CAGR through 2034, driven by Shopify Plus adoption.
Market Share by Industry Vertical
Retail was the largest vertical at 27.4% share, followed by Fashion at 22.1%, Electronics at 14.7%, Food & Beverage at 13.2%, Health & Wellness at 12.1%, and Others at 10.5%. Food & Beverage is the fastest-growing vertical, forecast at a CAGR of 16.3% through 2034.
Shopify Market Segment Comparison: Platform vs Services
| Metric | Platform Segment | Services Segment |
|---|---|---|
| Market Share (2025) | 62.4% | 37.6% |
| Projected CAGR (2026–2034) | 12.6% | 14.1% (Faster Growth) |
| Core Growth Drivers | SaaS-based commerce adoption, AI-powered features, and global expansion. | Embedded finance (payments, capital), fulfillment network, expanding partner ecosystem. |
| Primary User Base | Small to medium businesses (SMEs) and mid-market brands. | Broad adoption across all tiers, with strong enterprise usage. |
| Future Growth Outlook | Stable growth with slight share dilution as services expand. | Rapid acceleration driven by financial services and value-added offerings. |
Competitive Landscape
Shopify Inc. held an estimated 28.4% share of the global e-commerce platform market by merchant count in 2025. The company’s 2025 revenue exceeded $9.3 billion, with over 4.8 million active merchants globally. The Shopify App Store contains over 9,000 third-party applications, and the Shopify Partner ecosystem comprises over 50,000 developers, designers, and agencies worldwide.
The current competitive hierarchy in the global e-commerce platform market is as follows:
1) WooCommerce – 20.1% market share, leading due to its open-source flexibility and massive adoption.
2) Custom / Proprietary Platforms – 15–18% combined, driven by large enterprises building tailored solutions.
3) Wix eCommerce – 8–10%, popular among small businesses and creators.
4) Shopify Inc. – 10.32%, with strong performance in mid-to-large scale businesses.
5) Squarespace Commerce – 4–6%, focused on design-centric users.
Shopify Is Winning the Platform Wars
Shopify has pulled in 24,036 merchants from competing platforms, and the biggest source by far is WooCommerce, with 9,195stores making the switch. Wix (3,954) and Squarespace (2,223) follow behind.
| Platform | Stores Switching to Shopify |
|---|---|
| WooCommerce | 9,195 |
| Wix | 4471 |
| Squarespace | 2689 |
| Custom Cart | 1767 |
| Square Online | 561 |
| GoDaddy Online Store | 560 |
| Magento | 498 |
| PrestaShop | 408 |
| BigCommerce | 273 |
| Ecwid | 278 |
Number of Platforms Leaving Shopify
| Platform | Stores Leaving Shopify |
|---|---|
| WooCommerce | 7566 |
| Custom Cart | 3437 |
| Wix | 1394 |
| Squarespace | 601 |
| Square Online | 485 |
| Tiendanube | 484 |
| ShopDeck | 319 |
| YouCan | 273 |
| GoDaddy Online Store | 323 |
| Odoo | 275 |
Net-net, Shopify is still gaining significantly more merchants than it’s losing — a strong indicator that platform momentum remains firmly in its favor.
Shopify Technology Statistics – The Technologies Running Shopify Stores
Shopify merchants don’t just rely on built-in features; they layer third-party technologies to power performance, payments, and marketing. Currently tracking 875 different technologies with 24,453,708 collective installs across the platform.
Infrastructure tools dominate the top of the list. Cloudflare is used by 98.9% of stores, and Cloudflare CDN by 98.2%, making them near-universal on the platform. Arrive, Shopify’s package tracking solution, follows closely at 89.6%.
Payment options round out the top 10, with Apple Pay, Google Pay, Shop Pay, and PayPal Express Checkout all crossing the 1 million stores mark, a clear signal that merchants are offering multiple checkout options as standard practice.
| Technology | Number of Stores Using |
|---|---|
| Cloudflare | 2,889,625 |
| Cloudflare CDN | 2,868,970 |
| Arrive | 2,616,254 |
| Apple Pay | 1,689,921 |
| Google Pay | 1,565,956 |
| Shop Pay | 1,517,522 |
| PayPal Express Checkout | 1,486,461 |
| Google Ads Pixel | 1,031,324 |
| Google AdSense | 996,246 |
| YouTube Player | 859,233 |
Shopify Shipping Carriers Statistics – Top Shipping Carriers Used by Shopify Stores
Logistics is the backbone of any e-commerce operation. USPS leads as the most widely used carrier at 7.6% of all Shopify stores, followed by UPS at 5.8% and FedEx at 4.3%. The presence of Royal Mail, Australia Post, and Canada Post in the top 10 reflects the genuinely global spread of Shopify merchants.
| Shipping Carrier | Number of Stores Using |
|---|---|
| United States Postal Service (USPS) | 222,731 |
| UPS | 168,662 |
| FedEx | 125,820 |
| Royal Mail | 52,632 |
Other Shipping Carriers
| Shipping Carrier | Number of Stores Using |
|---|---|
| Australia Post | 42,195 |
| Canada Post | 27,056 |
| DHL | 12,489 |
| Correos | 12,307 |
| PostNord | 9,254 |
| Purolator | 5,569 |
Shopify Themes Statistics – The Most Popular Shopify Themes
With over 1,000 themes tracked on the platform, merchants have no shortage of design options. But a handful of themes clearly pull ahead. Trademark is the most widely used, powering 17.0% of all Shopify stores. Dawn holds second place at 8.9%, and Horizon comes in third at 7.7%.
| Theme | Number of Stores Using |
|---|---|
| Trademark | 496,188 |
| Dawn | 260,491 |
| Horizon | 225,244 |
| Debut | 124,686 |
| Rise | 121,735 |
| focal | 101,846 |
| Spotlight | 75,281 |
| Origin | 68,427 |
| Refresh | 62108 |
| Impulse | 54,692 |
Domain Distribution Across Shopify Stores
It’s no surprise that .com accounts for 67.9% of Shopify stores, making it their top-level domain. The remaining market is fragmented. shop (2.7%) and .store (2.6%) are the next most common. Regional exceptions do exist in Australia. .com.au edges out .com, but globally, .com remains the default choice for merchants building credibility.
| Top-Level Domain | Number of Stores | Percentage |
|---|---|---|
| .com | 1,982,135 | 67.9% |
| .shop | 77,665 | 2.7% |
| .store | 75,714 | 2.6% |
| .co.uk | 75,030 | 2.6% |
| .com.au | 64,380 | 2.2% |
| .de | 55,345 | 1.9% |
| .co | 41,746 | 1.4% |
| .ca | 40,211 | 1.4% |
| .in | 35,483 | 1.2% |
| .fr | 34,444 | 1.2% |
| Other | 438,766 | 15.0% |
| Total | 2,920,919 | 100.0% |
The Biggest Stores on Shopify
Shopify isn’t just for small businesses. Some of the internet’s highest-traffic retailers run on the platform. Here are the top Shopify stores by worldwide rank:
| Store | Domain |
|---|---|
| SKIMS | Skims.com |
| QVC | qvc.com |
| Fashion Nova | fashionnova.com |
| Ring | ring.com |
| Alo Yoga | aloyoga.com |
Shopify Social Media Usage Statistics
Social media isn’t optional for e-commerce anymore; it’s where discovery happens. Shopify merchants know this, and the numbers show a clear pecking order where brands are choosing to show up.
Instagram leads by a significant margin, with 46.6% of all Shopify stores using it. Facebook follows at 27.3%, and TikTok is still relatively young as a commerce channel, having already climbed to 12.8%, ahead of both YouTube and Pinterest.
| Platform | Users/Stores |
|---|---|
| 1,359,821 | |
| 797,834 | |
| TikTok | 372,635 |
| YouTube | 337,534 |
| 210,199 | |
| 195,208 | |
| 154,584 | |
| 50,878 | |
| Facebook Group | 20,602 |
| Snapchat | 7,562 |
| Apple Music | 2,687 |
| SoundCloud | 2,227 |
| Yelp | 1,811 |
The gap between the top three and the rest is steep. Instagram alone has more presence than Facebook, TikTok, and YouTube combined, making it the single most important organic channel for Shopify merchants today.
How Shopify Merchants Stay Reachable?
Social media drives awareness, but when customers need help or have questions, they fall back to direct contact. Email remains the dominant channel 57% of Shopify stores list an email address on their website, covering over 1.6 million stores.
Phone numbers are also widely used, with 33% of merchants providing one, a notable commitment to real-time customer support, especially for higher-ticket or service-heavy products.
| Contact Type | Stores |
|---|---|
| 1,662,148 | |
| Phone | 961,013 |
Number of Products that Shopify Merchants Actually Sell
One of the most telling signs of a store’s strategy is its catalog size. Is it a tight, curated offering or a sprawling marketplace? The data reveals that most Shopify merchants keep it clean.
Over a quarter of stores, 26.5%, sell just 1 to 9 products, making small, focused catalogs the single most common approach on the platform. Another 16.7% sell between 10 and 24 products, and 12.4% fall in the 25–49 range. Together, that means more than half of all Shopify stores carry fewer than 50 products.
| Products Sold | Stores |
|---|---|
| 1 – 9 | 774,090 |
| 10 – 24 | 488,676 |
| 25 – 49 | 363,332 |
| 50 – 99 | 322,880 |
| 100 – 249 | 320,763 |
| 250 – 999 | 274,684 |
| 1000 – 4999 | 116,623 |
| 5000 – 9999 | 18,458 |
| 10000 – 24999 | 11,584 |
| 25000 – 99999 | 9,977 |
Shopify POS Statistics
For years, the biggest headache in retail was the gap between online and offline, two separate systems, two separate data sets, and no clean way to stitch them together. A new report from EY is putting hard numbers on just how much that’s changing and Shopify POS is at the center of it.
The “Future Proofing Retail: Embracing Unified Commerce” report by Ernst & Young draws on data from nearly 4,000 organizations, a survey of over 600 businesses, and direct interviews with senior retail and digital commerce leaders. The findings make a strong case that unified commerce isn’t a future trend; it’s already happening, and merchants using Shopify POS are seeing measurable results.
What the Numbers Actually Say?
The EY report doesn’t deal with vague promises but highlights vital insights. Here’s what Shopify POS users reported:
The business case for switching is clear. 43% of survey respondents cited wanting a unified platform as a key reason for choosing Shopify POS, the desire to stop managing fragmented systems and run everything from one place.
Mid-market retailers are studying hard. 85% of mid-market retailers are actively using Shopify POS omnichannel features to drive growth across both online and offline channels — not as an experiment, but as a core growth strategy.
The growth numbers are hard to ignore. Shopify POS users reported an average quarterly omnichannel sales growth of +150% year over year. That’s not a small lift — that’s a compounding structural advantage.
It’s faster and cheaper to implement than alternatives. Shopify POS has a 20% faster implementation time than other POS solutions surveyed and, on average, a 22% lower total cost of ownership (TCO) than other market solutions. For retailers evaluating platforms, that’s a meaningful combination of speed and savings.
The sales uplift is built in. On an aggregate basis, Shopify POS delivers an 8.9% equivalent uplift in annual sales for retailers — a figure that compounds significantly over time.
Latest POS Update 2026
In early 2026, Shopify shipped new POS app versions v10.20 and v11.0 with improvements focused on in-store workflows and operational efficiency. These aren’t cosmetic updates. They reflect a clear product direction: making Shopify POS the central hub where store inventory, customer profiles, and analytics all connect back to the same online backend.
For retailers still running separate systems for their physical and digital operations, the window to unify is shrinking, and the cost of not doing so is becoming clearer.
Shopify Payments Statistics
Shopify Payments has become the default transaction layer for merchants on the platform, and the data backs up decisively.
As of 2025, 1.89 million merchants actively use Shopify Payments, representing about 90% of all eligible stores. In Q1 2025, total payment volume reached $47.5 billion, up from $36.2 billion in Q1 2024. At the same time, Shopify Payments holds roughly 15% of the global payment-processing software market.
| Metric | Data |
|---|---|
| Active merchants using Shopify Payments | 1.89 million (~90% of eligible stores) |
| GMV processed via Shopify Payments (Q1 2025) | $47.5 billion |
| Share of Shopify GMV (Q1 2025) | 64% |
| Total Shopify GMV (2024) | $292.3 billion |
| Market share in payment processing software | ~15% |
| Shop Pay’s share of gross payment volume | 38% |
| Shop Pay GMV growth | +65% to $27 billion |
| Shop Pay checkout conversion vs. competitors | Up to 36% better |
| Cost savings vs. third-party gateway | ~34% lower total cost |
| Annual savings on $25K/month GMV | $4,500 |
| Chargeback reduction via fraud tools | 20% |
| Merchants save annually via fraud protection | $62 million |
| US average payout time | 2 business days |
| Shopify Balance payout time | 1 business day |
| Countries where Shopify Payments is available | 39 countries |
| New countries added (recent expansion) | 16 new countries |
| Merchant Solutions’ share of Shopify revenue | 76% |
| Subscription Solutions’ share of Shopify revenue | 24% |
Shopify Payment Available in the following countries
| Country | Country | Country |
|---|---|---|
| United States | Romania | Lithuania |
| Croatia | United Kingdom | Portugal |
| Liechtenstein | Canada | Switzerland |
| Poland | Latvia | Bulgaria |
| Sweden | Norway | Japan |
| Belgium | Spain | New Zealand |
| Italy | Austria | Slovenia |
| Netherlands | Ireland | Australia |
| Singapore | Mexico | Hungary |
| Hong Kong SAR | Greece | Gibraltar |
| Germany | France |
Shopify Cart Abandonment Statistics 2026
Cart abandonment is not a fringe problem. It is the default behavior of the majority of online shoppers — and its scale is impossible to dismiss.
The global average cart abandonment rate in 2026 sits between 70% and 78%, with the most recent global figure from August 2025 putting it at 78.77%. For every 100 shoppers who add items to their cart, only 22 to 30 actually complete checkout.
Overall Abandonment at a Glance
| Source | Abandonment Rate |
|---|---|
| Baymard Institute (avg of 50 studies) | 70.19% |
| August 2025 Global Figure | 78.77% |
Abandonment by Device
The device a shopper uses has a direct and measurable impact on whether they complete a purchase.
| Device | Abandonment Rate |
|---|---|
| Mobile | 75-78% |
| Desktop/Tablet | 65-68% |
Mobile abandonment runs 15 to 20 percentage points above desktop. The primary causes are smaller screens making checkout forms harder to complete, slower data entry, distracted browsing behavior, and suboptimal mobile checkout experiences in many stores.
Abandonment by Industry
Not all industries face the same challenge. Comparing your rate to your specific vertical matters far more than benchmarking against the global average.
| Industry | Abandonment Rate |
|---|---|
| Travel & Hospitality | 87.1% |
| Fashion & Apparel | 84.6% |
| Luxury & Jewelry | 82.8% |
| Beauty & Personal Care | 80.9% |
| Home & Furniture | 80.3% |
| Automotive | 75.4% |
| General Retail | 72.2% |
| Electronics | 71.8% |
| Grocery & Essentials | 50–62% |
| Pet Care | 56.1% |
Why Shoppers Abandon?
Unexpected shipping, tax, and fee costs are the single biggest driver, accounting for 48-49% of all abandonments. Every item on this list is a solvable problem, not an inevitable one.
| Reason | % of Abandonments |
|---|---|
| Unexpected costs (shipping, tax, fees) | 48–49% |
| Required account creation | 24–26% |
| Slow or long delivery | 21% |
| Lack of trust in payment details | 19% |
| Complicated checkout process | 18% |
| Couldn’t calculate the total cost upfront | 17% |
| Limited payment options | 13% |
| Website errors or crashes | 12% |
| Unsatisfactory return policy | 11% |
The Revenue at Stake
Cart abandonment costs US ecommerce stores $18 billion annually. Globally, the total value of abandoned carts reaches $4 trillion. Even recovering a fraction of that represents meaningful revenue for individual stores.
Shopify Mobile Commerce Statistics
Mobile is no longer an emerging channel; it is the dominant one. 79% of all Shopify traffic now comes from mobile devices. That is not a trend to prepare for. It is the current reality every store owner is already operating in, whether their storefront is optimized for it or not.
The order volume backs up. Mobile drives 66% of all online orders across ecommerce. On Shopify specifically, given the platform’s traffic composition, that share is almost certainly higher.
The abandonment problem is significant and measurable.
Mobile cart abandonment runs between 75–78%, a full 10 percentage points above desktop 65–68%. The causes are well-documented screen size limitations, environmental distractions, and checkout flows that were never truly built for a thumb. Ignoring this gap leaves a substantial portion of near conversions on the table.
The spending gap is equally worth noting.
Desktop orders average $155.75. Mobile orders average $112.29. Mobile shoppers compensate with frequency rather than order size. They return more often, even if each transaction is smaller. Global Shopify AOV sits between $85 and $92 across all stores, while top-performing merchants consistently exceed $120 per transaction.
The implication is straightforward.
Mobile shoppers move fast and need answers immediately on returns, shipping timelines, sizing, and product differences. They will not wait. The stores that capture these customers are the ones that meet them in real time. eCommerce phone support directly addresses that window between intent and abandonment, converting browsers into buyers before the moment passes.
Shopify Acquisition
Over the past year, Shopify completed six small acquisitions to enhance its AI leadership, with many founders assuming leadership roles within the company. These weren’t blockbuster deals they were deliberate, targeted moves to bring elite AI talent in-house fast.
Notable hires include Nicolas Grasset from Peel Insights, Ray Reddy from Ritual, and Rousseau Kazi from Threads, among others. BestofAI As Shopify CFO Jeff Hoffmeister put it during the company’s February earnings call, these were “very tactical, thoughtful AI hires.”
Shopify acquires AI search startup Vantage Discovery in 2025
Shopify’s biggest AI move came in early 2025 with the acquisition of Vantage Discovery, a retail search startup founded by former Pinterest engineers Lance Riedel and Nigel Daley. The deal was valued at $59 million for 100% of outstanding shares.
Vantage brings AI-powered, “Pinterest-like” product discovery to e-commerce using large language models combined with vector databases to deliver smarter, more personalized search results. The technology is being integrated directly into Shopify’s Search APIs, Shop, and Storefront search offerings.
Shopify Revenue & Financial Highlights
Shopify delivered a standout financial performance in 2025, marked by accelerating growth across GMV, revenue, and profitability. GMV surged 29% YoY, continuing a strong upward trend from previous years, while total revenue grew 30% annually, reaching nearly 3.9× its 2020 levels. The company maintained an impressive streak of 11 consecutive quarters with 25%+ revenue growth, signaling consistent demand and operational efficiency at scale. Its >14% share of the U.S. e-commerce market further reinforces Shopify’s position as a dominant global commerce platform.
A deeper look at constant currency metrics confirms that Shopify’s growth is fundamentally strong and not significantly impacted by foreign exchange fluctuations. Both GMV and revenue maintained near-identical growth rates even after currency adjustments, while merchant solutions revenue (+35%) remained the primary growth driver. Profitability also improved meaningfully, with operating income rising 37% YoY and gross profit increasing steadily highlighting better monetization and cost discipline across the platform.
Quarterly trends and H2 performance underscore Shopify’s ability to scale during peak demand periods. Q4 2025 emerged as a record-breaking quarter, fueled by strong holiday sales and BFCM performance, where merchants generated $14.6 billion in sales (+27% YoY). Growth was driven by independent businesses, increasing cross-border commerce, and higher adoption of Shop Pay.
Looking ahead, Shopify’s Q1 2026 outlook remains highly optimistic, with projected revenue growth in the low 30% range, sustained profit expansion, and disciplined expense management—indicating continued momentum into 2026.
Shopify AI Commerce Stats
Shopify has moved well past AI experimentation; the numbers confirm full-scale adoption.
Shopify’s AI adoption rate stands at 94.9%, nearly 50 percentage points above the community median of 45.1%. The Motley Fool. That is not a marginal lead. It reflects an organization that has embedded AI into its core engineering workflows at every level.
The productivity outcome is a 1.16× lift, translating to 16% faster code delivery without compromising quality. The Motley Fool Shopify’s code quality score of 35.5% beats the community median of 23.8% by 11.7 percentage points, directly disproving the idea that speed and quality conflict when AI is involved.
Notably, 22.3% of commits contain AI-generated code spread across the organization rather than concentrated among a few individuals; that breadth separates a genuine AI-driven culture from surface-level adoption.
For merchants building on Shopify, this matters. The platform they rely on is being built and improved faster, more reliably, and at a scale that few technology organizations can match.
Shopify Recent News and Updates
Shopify’s 2026 updates are not incremental. They reflect a fundamental shift in how commerce works and where it happens.
Shopify Merchants Can Now Sell Inside AI Chats
The most significant development of March 2026 is the launch of Agentic Storefronts. Millions of Shopify merchants can now sell to ChatGPT users directly, with Agentic Storefronts giving them out-of-the-box access to major AI channels, including ChatGPT, Microsoft Copilot, AI Mode in Google Search, and the Gemini app, all managed centrally from the Shopify Admin.
For merchants, products become discoverable in ChatGPT by default, with no separate integrations, apps, or transaction fees beyond standard processing rates. Orders flow into the admin with ChatGPT referral attribution, and merchants remain the merchant of record, retaining full ownership of customer relationships and data.
Shopify has also rolled out an Agentic Plan globally, a new option for brands not currently using Shopify for ecommerce to add their products to the Shopify Catalog and make them shoppable across ChatGPT, AI Mode in Google Search, the Gemini app, Microsoft Copilot, and the Shop App.
Marketing Automations Are Being Reorganized
On the operational side, as of March 24, 2026, Shopify has moved marketing automations to new locations within the admin. Automations using Shopify Messaging emails have moved to the Shopify Messaging app, while automations with marketing activities from other apps are now available in the Shopify Flow app. Existing automations continue to work without any action required from merchants.
Shopify Plus Is Scaling Earlier into Growth-Stage Brands
A notable trend in 2026 is that more mid-market and fast-scaling DTC brands are moving to Shopify Plus earlier, leveraging its advanced automation, AI-powered tools, and multi-channel selling capabilities before they strictly need to. Yahoo Finance The key 2026 trends driving this adoption include AI-powered commerce, headless architecture, omnichannel expansion, and mobile-first checkout optimization with tools like Shopify Flow and Launchpad enabling brands to automate operations at scale without increasing team size.
Taken together, these updates signal a clear direction: Shopify is positioning itself as the commerce infrastructure layer behind every AI conversation, every channel, and every stage of business growth.
Wrapping Up
This blog has covered the full scope of Shopify’s growth and current standing from its $17 IPO in 2015 to a record-breaking $14.6 billion BFCM 2025, from mobile commerce trends and cart abandonment statistics to Shopify Plus enterprise growth, AI adoption, and the latest platform updates, including Agentic Storefronts and ChatGPT commerce integration. Every section is backed by verified data and real numbers, giving merchants, investors, and e-commerce professionals a complete, up-to-date picture of where Shopify stands today and where it is heading. If you are building on Shopify, evaluating it, or simply tracking the e-commerce landscape, the stats covered here leave little room for doubt. This platform continues to set the standard for modern commerce at every level.
Disclaimer:
The statistics, figures, and data points referenced throughout this blog are sourced from third-party research reports, industry publications, and official platform announcements available at the time of writing. While every effort has been made to ensure accuracy, numbers related to ecommerce performance, platform usage, stock prices, cart abandonment rates, and revenue figures are subject to change over time and may vary based on methodology, market conditions, and reporting periods.
Resource Links
https://s27.q4cdn.com/572064924/files/doc_financials/2025/q4/Website-Financials-Q4-2025.pdf
https://www.shopify.com/news/bfcm-data-2025
https://www.shopify.com/news/shopify-q4-2025-financial-results
https://www.charleagency.com/articles/shopify-statistics/
https://sherocommerce.com/shopify-history/
https://dataintelo.com/report/global-shopify-market
https://redstagfulfillment.com/shopify-market-share/
https://redstagfulfillment.com/how-many-shopify-stores-exist/
https://trends.builtwith.com/websitelist/Shopify-Plus
https://colorlib.com/wp/shopify-statistics/
https://storeleads.app/reports/shopify
https://storeleads.app/reports/shopify/print-on-demand-apps
https://www.shopify.com/blog/retail-roundup-february-2026
https://help.shopify.com/en/manual/payments/shopify-payments/supported-countries